So we migrate our WordPress to Azure Web Service. After configuring the usual stun we want to enable SSL for our URL. We purchase our SSL from NameCheap after all those steps like creating CRS and stuff we manage to get the cert approved. But we want to ensure that all is great and working, so just heads off to the cheat code above and enter the URL you want to check. Pretty Simple right?
decoder.link – Checking mycheat.life SSL cert configuration Image by Darwin Laganzon from Pixabay
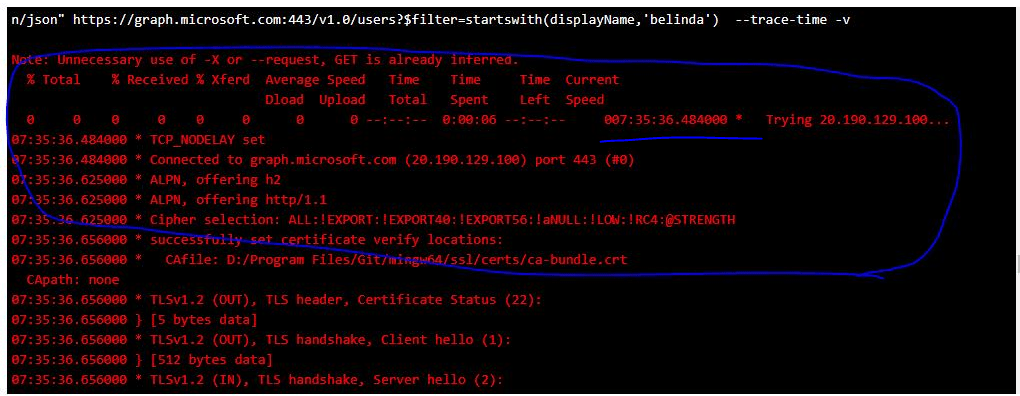
So I have web API hosted in Azure App Service which returning a result from Microsoft Graph API about some user. This API is somehow bloody slow… it took almost 8 seconds to return result. I’m puzzled! I want to know where the heck the slowness came from. So I spin KUDU from the App Service, and trigger the cheat code. Here I saw that it took 7.35 secs to connect to graph.microsoft.com from App Service.
curl result – connecting to graph.microsoft.com
I’m logging ticket to Microsoft Azure support to know WHY! still puzzled at the moment.
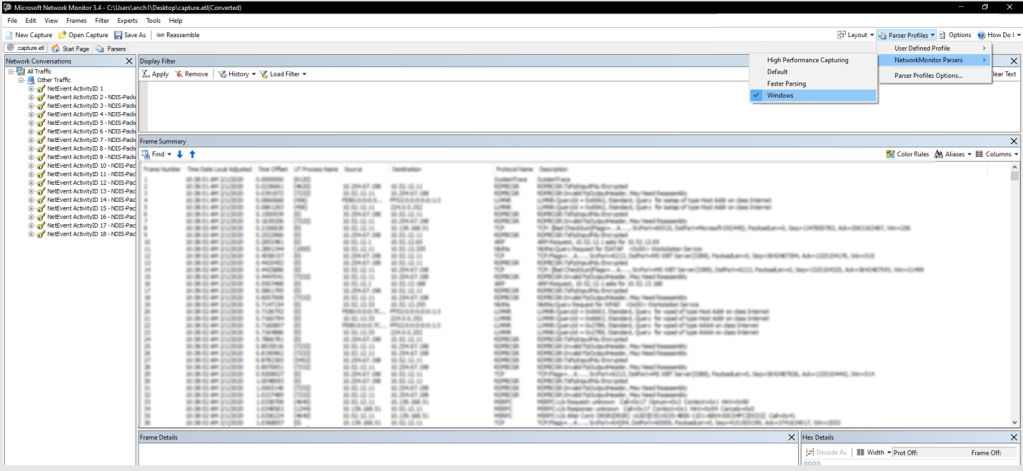
So we have .ETL file from previous netsh session, what can we do with it? I installed Microsoft Network Monitor 3.4 (download here) – Microsoft why Archive such amazing tool!? 😦 – Once it’s installed I launch it Then the usual File -> Open -> Capture… and select the .etl file Set the “Parser Profile”
Microsoft Network Monitor – Setup Network Parser
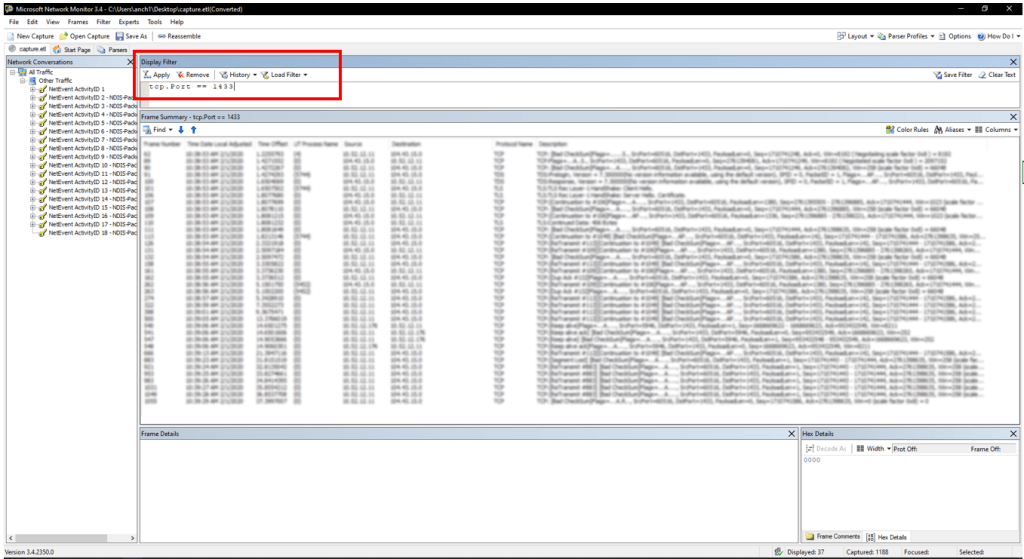
Once that’s done, we can setup the filter “tcp.Port == 1433” at the Display Filter area and click “Apply”
Microsoft Network Monitor – Applying TCP Port Filter
I’m working with amazing data warehouse project where all ETL is done in Stored Procedure and being documented in WORD document! It’s just 7MB and 194 pages, good reading material for couple of hours flight, hope I don’t fall a sleep…
My objective here is to get the dependency between tables (oh, not much constraints being done on this DB – isn’t that amazing!?). And understand the logic a.k.a data lineage. Too much mystery here.
So I deployed the schema to Azure SQL just for my playground.
Spent couple of hours googling the internet and came across this tool ApexSQL Analyze, reading the features seems exactly what I need. So I downloaded the tools and start the trial.
I started the tool and here is the landing screen, super clean!
ApexSQL Analyze – Landing Screen
What a pleasant surprise that it supported Azure SQL with Active Directory. YAY! no need to create dummy SQL Login account 🙂
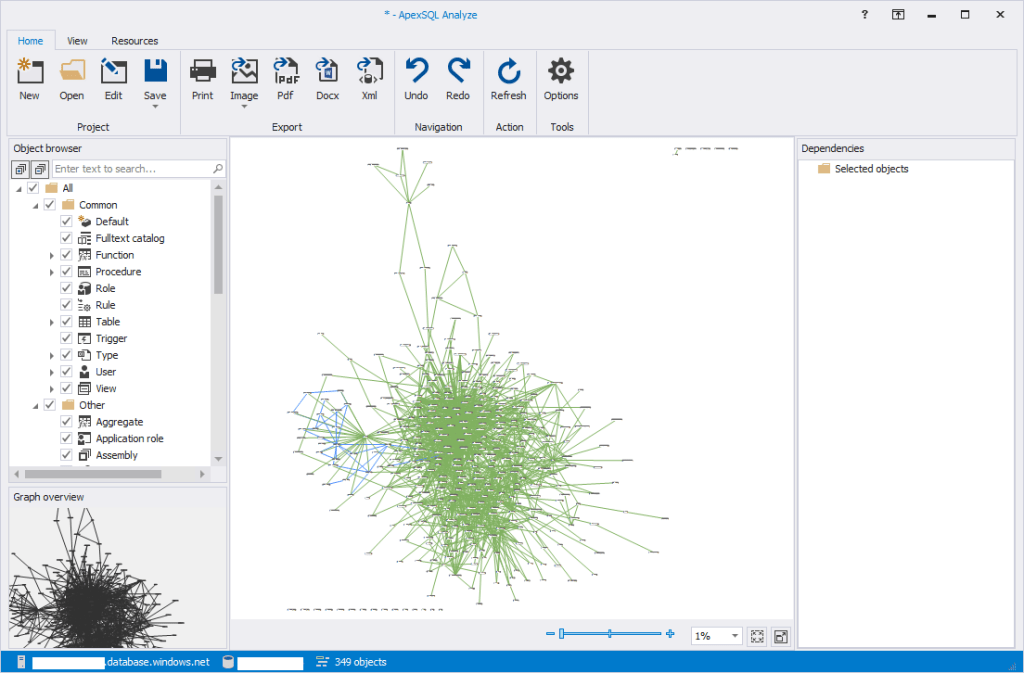
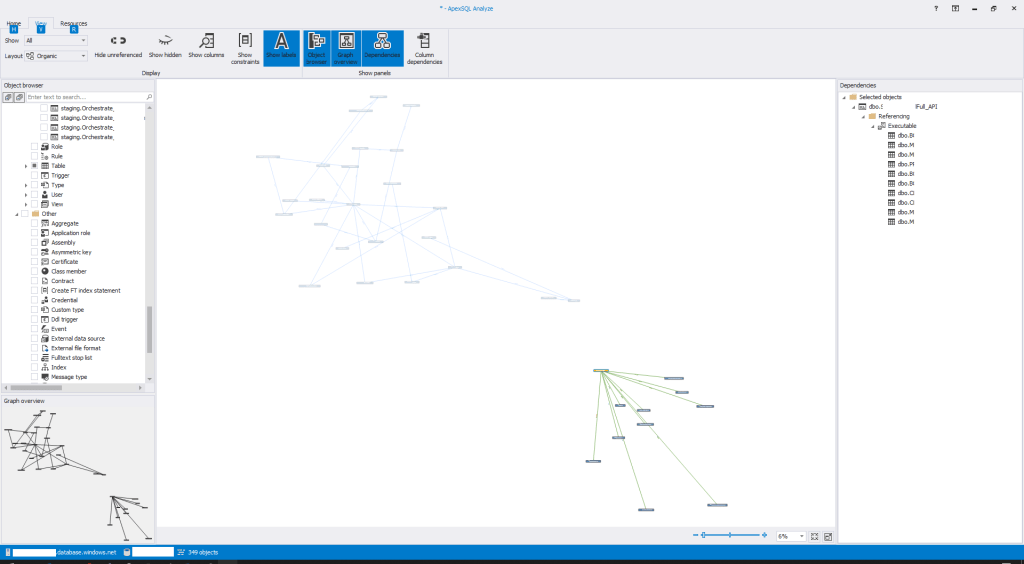
After waiting for awhile, it generate a fancy map.
ApexSQL Analyze – Object Dependency Map
After playing for couple of moment I just feel this is not exactly what I want. While it kind if nice to show visually which object depends on which one others, but it stop at it. It doesn’t go into deeper stored procedure and perform at column level.
ApexSQL Analyze – Stored Procedure Dependency Map
Summary It’s a neat and easy to use tool to show visually object dependencies but I think it stop there.
There are too many time we need to troubleshoot issue all the way to network level. Unable to connect, strange application error, etc. Nothing beats the capturing network packets to know at the lowest level. Use the above cheat code to capture the packet for analysis. Next time I’ll post on how to analyze the captured packet.
Warning The captured file can be huge, quickly turn off the cheat once issue reproduced!
We added partitions to our external table to manage our data easily. Multiple folders are set on our data lake. How can we refresh the hive to know new partitions are added?
Quite Simple!
run the cheat code above and voila the hive partition is updated! don’t worry it wont messed up your dataset. I was afraid running the above statement in the beginning, but now… WHACK! just run it!